GradGraph
About
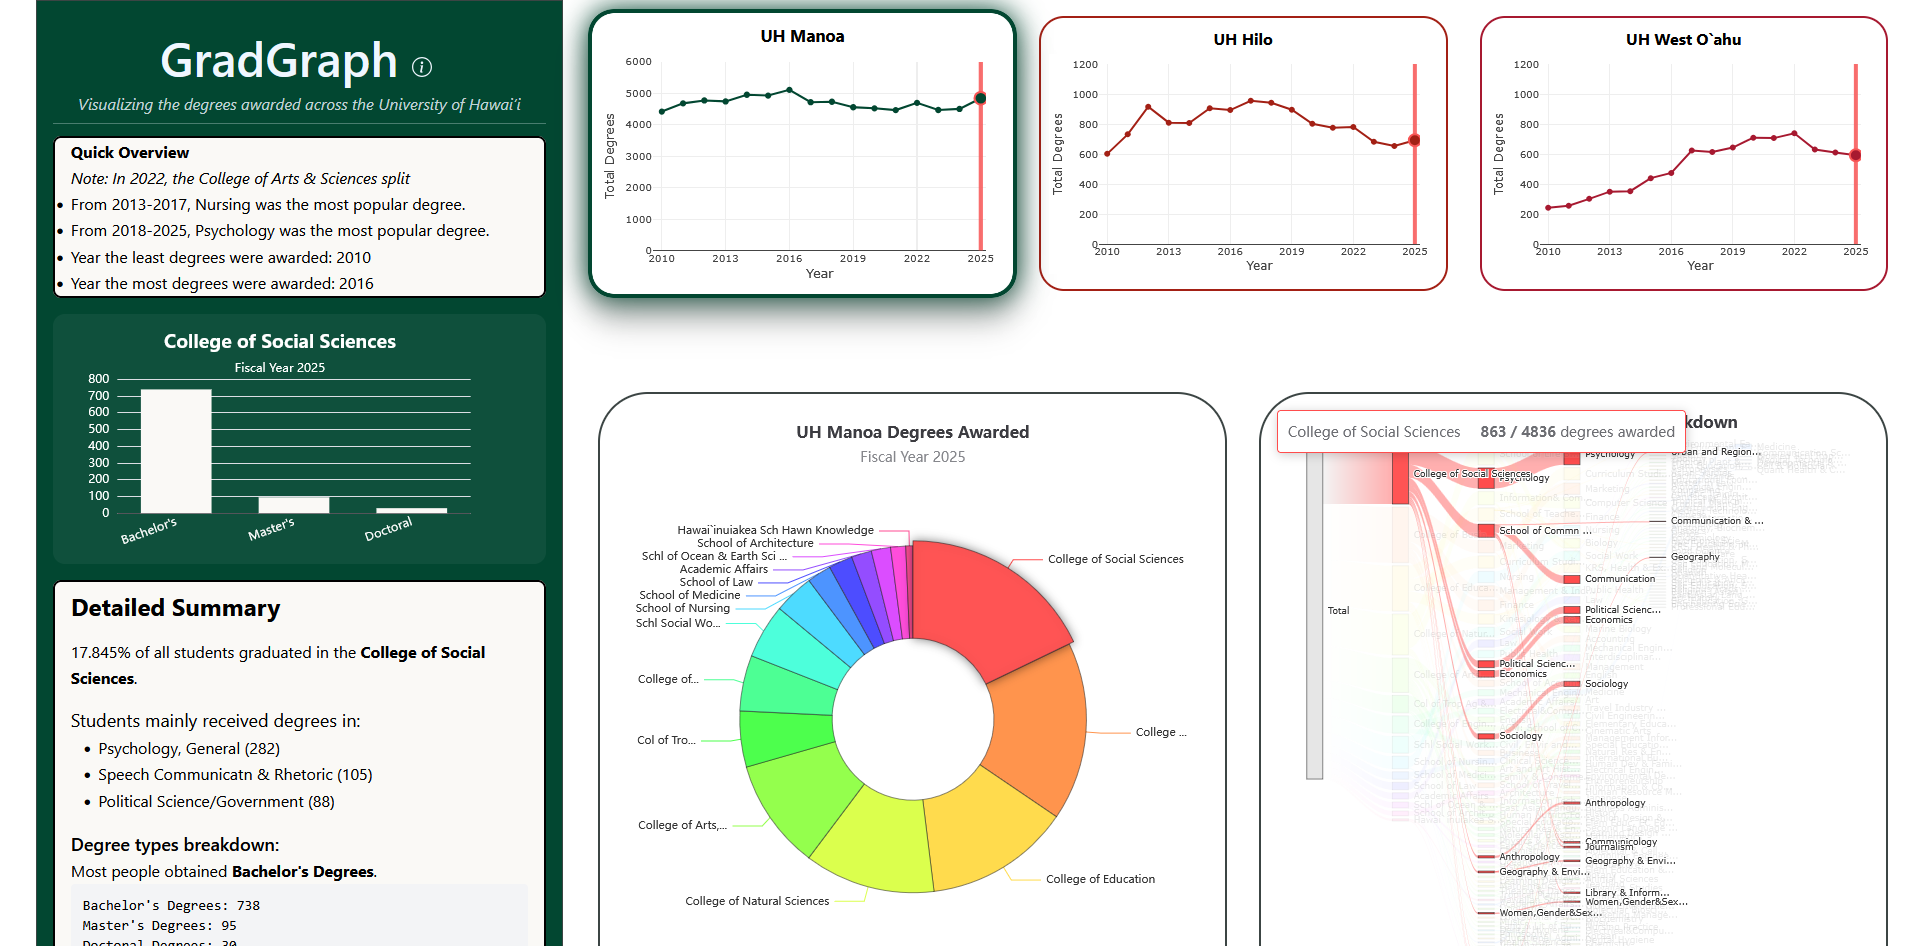
GradGraph is a website that visualizes the number of degrees awarded by fiscal year, campus, degree type, and academic group via various charts using Apache ECharts and Plotly.js. The data that was used is a CSV file that is available on Hawaii Open Data, which was filtered to focus on three UH campuses: UH Manoa, UH West O`ahu and UH Hilo. This website was created in collaboration with Adam Graham and Jaren Pinera as a project assignment for ICS 484. I was responsible for the sankey diagram, the website layout, and some of the CSS styling.
Experience
This was my first time using several different tools and libraries. Other than Apache ECharts and Plotly, Next.js was used as the framework for the website, which was deployed on Vercel. Additionally, I also used d3js to parse the CSV and generate the colors seen on the sankey.
Source: eric-z4/gradgraph